less than 1 minute read

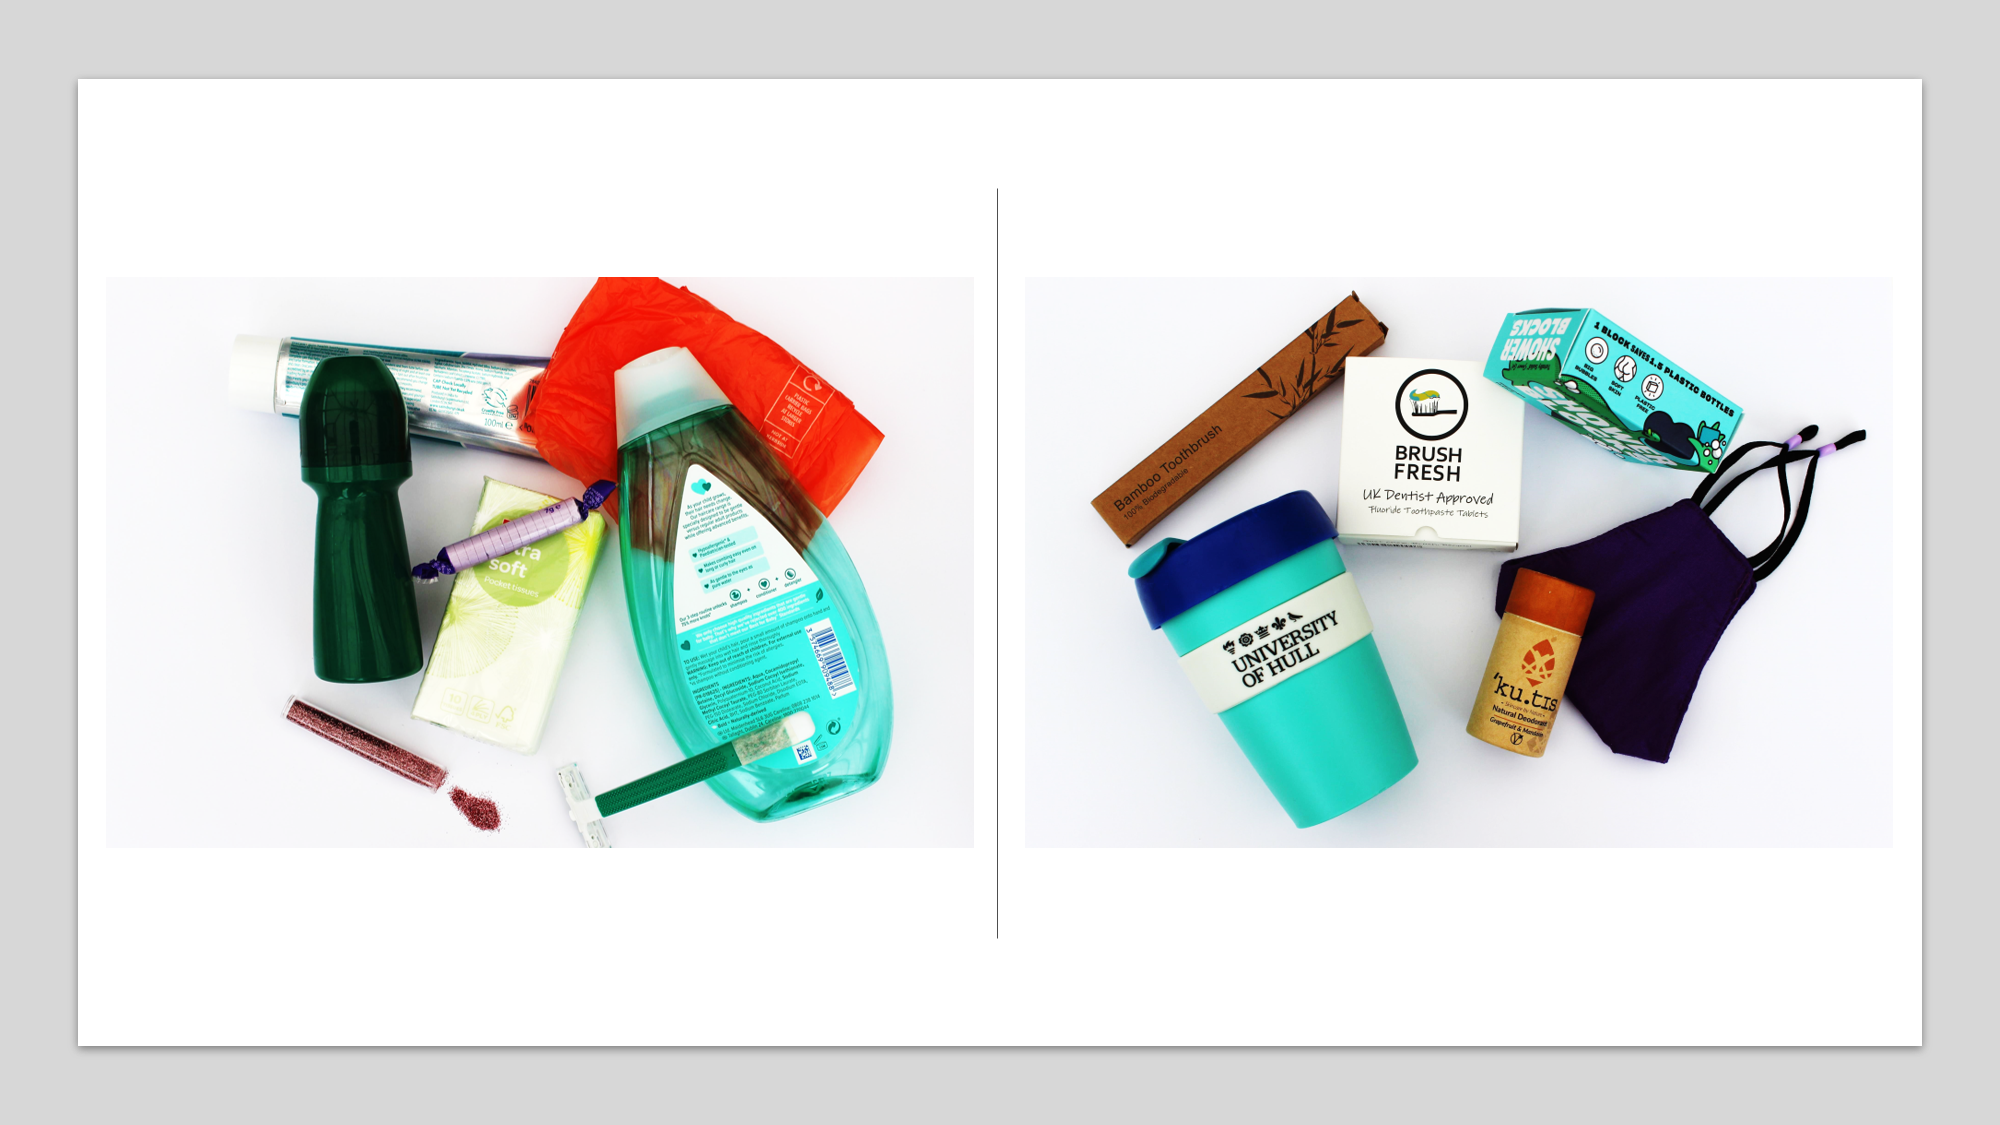
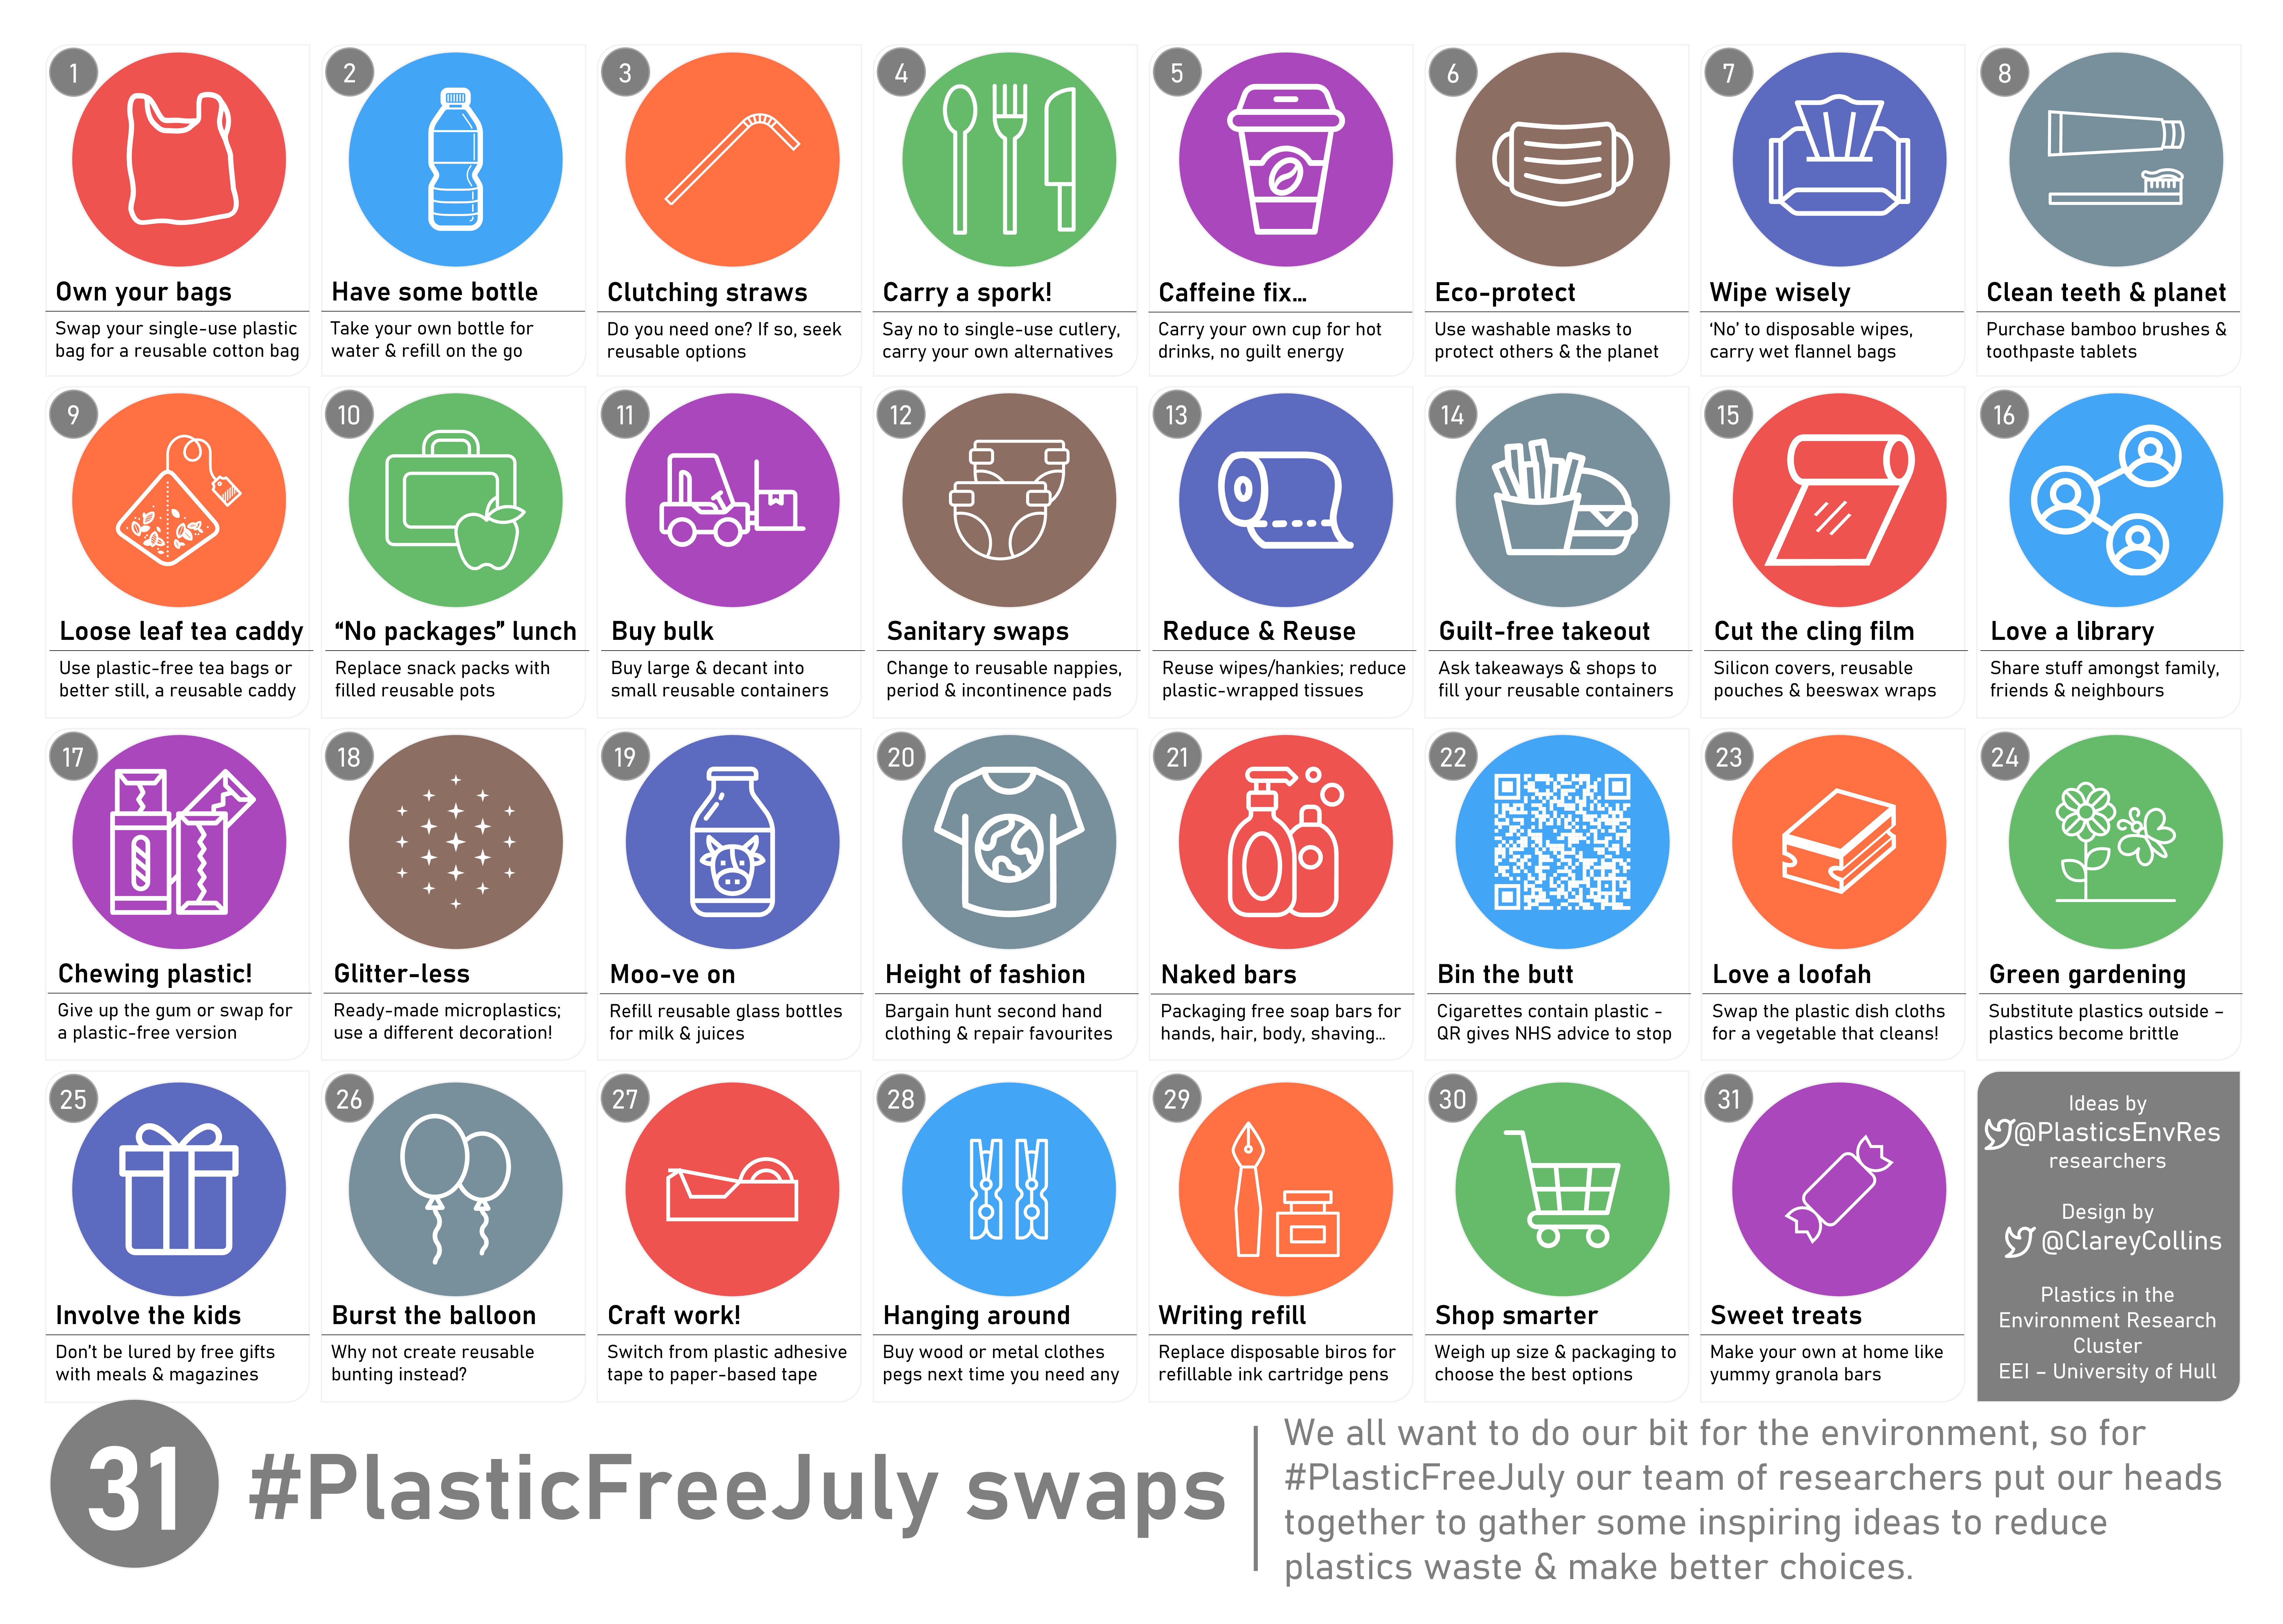
Graphics for our “Top tips for tackling plastic pollution from marine scientists” article in The Conversation https://theconversation.com/top-tips-for-tackling-plastic-pollution-from-marine-scientists-164602

Infographic showing length of time coronavirus was still traceable on four different surfaces.  Still on day 7 of the surgical mask, no longer on day 7 for the plastic surface, no longer on day 2 for the cloth surface and no longer after 3 hours on the paper surface.
Time until no infectious virus could be recovered on different surfaces.
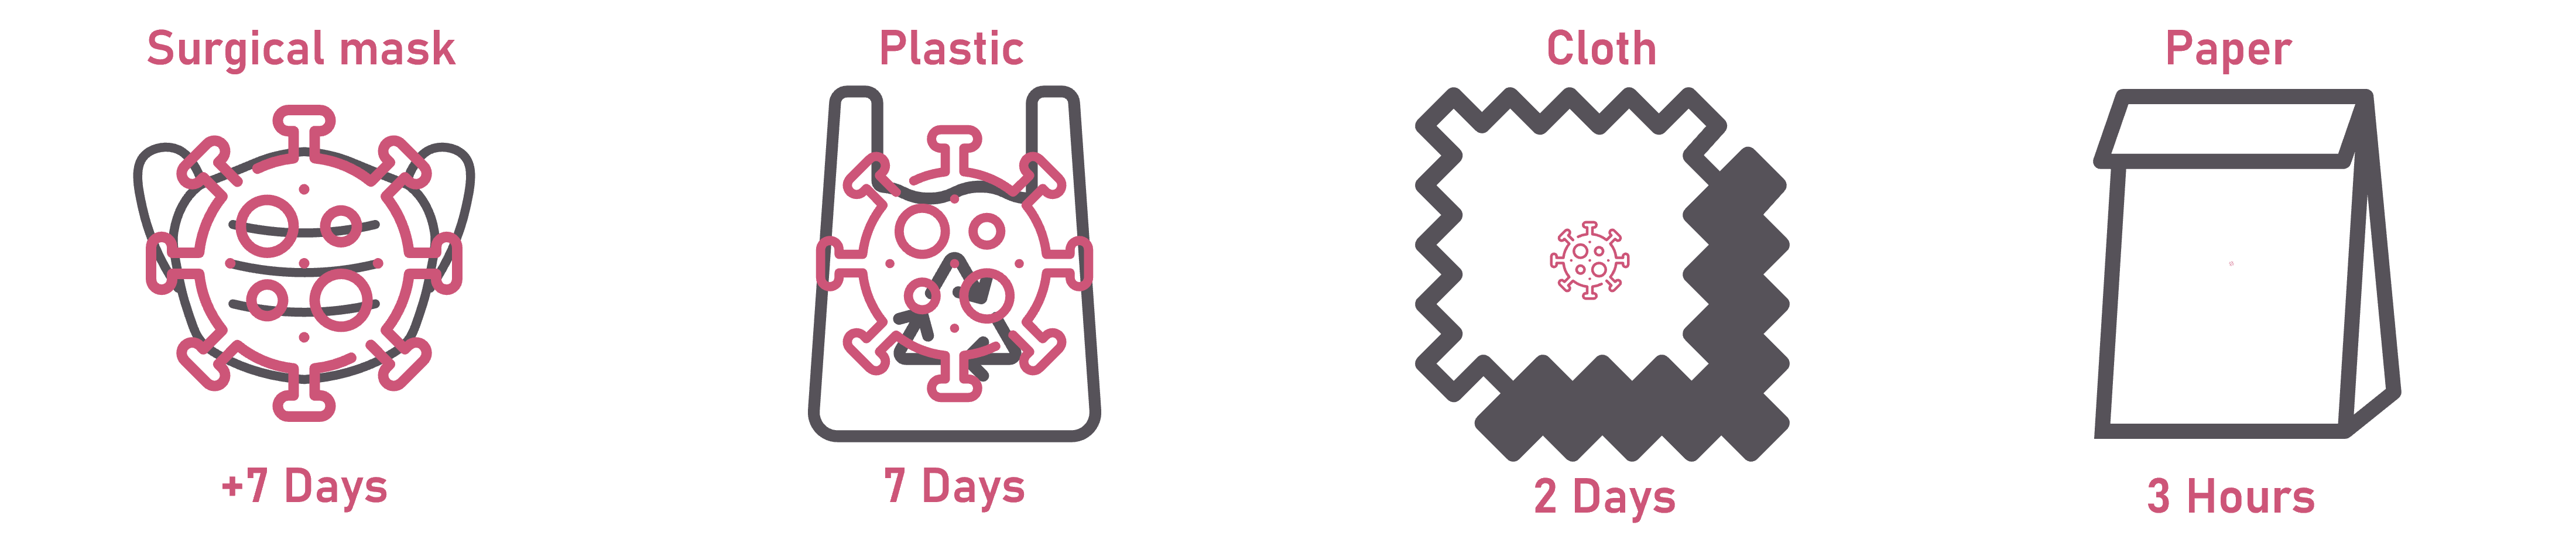
Using data from: Chin et al. (2020) DOI: 10.1016/S2666-5247(20)30003-3

virus-stabilityCC.png

Infographic giving 31 swap suggestions to move away from relying on plastic waste products
31 Plastic-Free July Swaps.

31swapsCC.png

Infographic considering environmental sustainability of different bag materials. To match 1 use of a single-use HDPE plastic bag, you would need to use a bag for life up to 10 times, a durable plastic bag up to 20 times, a single-use paper bag at least 8 times and a reusable cotton bag around 150 times.
Reuse alternative bags ‘n’ times to match environmental impact of single-use plastic bag.
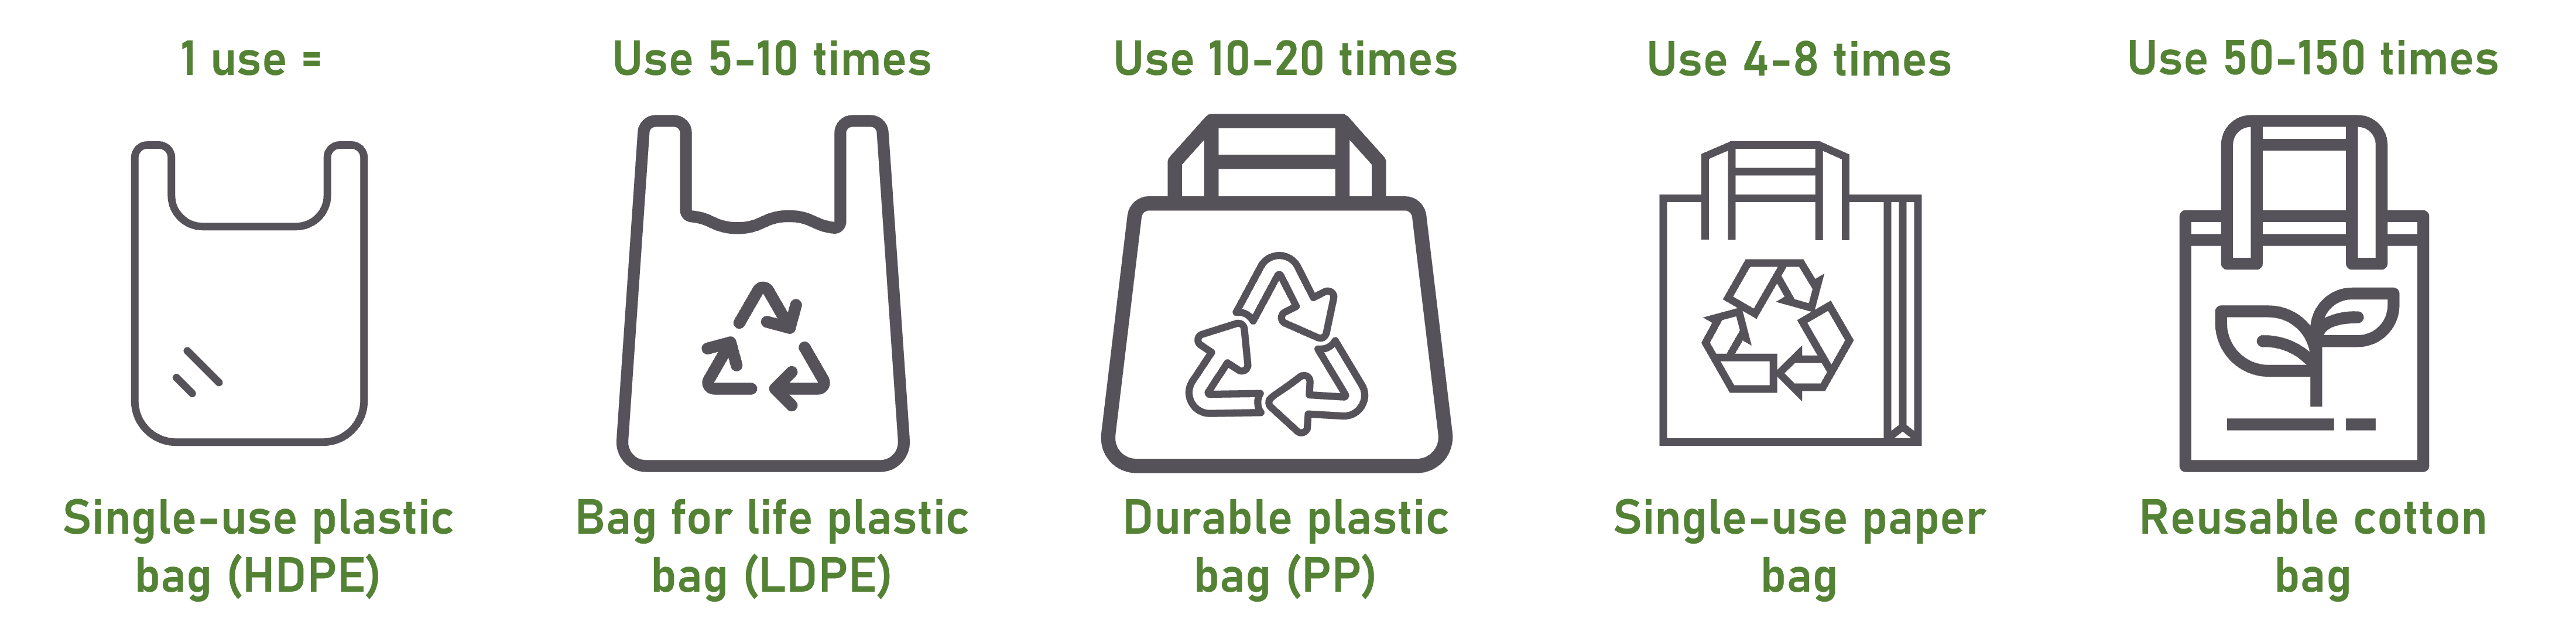
Using data from: United Nations Environment Programme (2020). Single-use plastic bags and their alternatives - Recommendations from Life Cycle Assessments

alt-bagCC.png

Photo showing single-use plastics items on the left and reusable or alternatively packaged items to the right.

plasticvsalternatives.png